Case studies
One version of the truth, before anyone spends a rand
The information needed for a sound energy decision usually already exists. It is spread across utility bills for a dozen accounts, three inverter portals, a solar contract in a drawer, supplier quotes nobody asked for, and a site walk-down nobody wrote up.
We put all of it in one place and check each source against the others. Most of what follows came out of those checks rather than out of a model.
Clients, sites and suppliers are not named, and figures are rounded. Every figure comes from the engagement's own records.
How the work fits together
-
Gather
Every bill, meter feed, contract, quote and site observation, in one place.
-
Cross-check
Bill against tariff, meter against bill, contract against output, quote against quote.
-
Decide
Every option on one financial basis, ranked by return against investment.
-
Measure
After installation, what was delivered compared with what was promised.
What we bring together
- Utility bills, line by line
- Utility and municipal tariffs
- Smart meters and inverter portals
- Site surveys and equipment registers
- PPA contracts and invoices
- Supplier quotes and price lists
- Financial models
- Post-implementation measurement

The situation
A business running operating sites, warehouses and processing plants buys electricity through many separate utility accounts: most on time-of-use tariffs, a few from a municipality, some alongside a solar power purchase agreement. Each account had its own bill, its own contact and its own history. Nobody could say what the business spent per site, whether each account sat on the right tariff, or which project ideas deserved capital first.
What we brought together
- Every utility bill, read charge by charge: time-of-use energy, network capacity and demand, reactive energy, fixed charges and generation credits.
- The published tariffs, so each bill could be recomputed independently.
- A premise and transformer register from site visits: location, transformer size, and the pumps, drives and generators each supply point feeds.
- Interval data from the inverter and metering platforms already on site.
- The solar contracts and their monthly invoices.
What the checks found
- An account on a different tariff from the one on record. The energy rates differed by about two-thirds, which changes every saving calculated for that site.
- A supply point billed at a higher notified maximum demand than the records showed: 600 kVA against 500, about R6,000 a month in capacity charges.
- Bills filed against the wrong account, so one site's history was attached to another's.
What the client now has
One board pack that compares every site on the same rows: consumption and spend, maximum demand against notified, cost per kWh, and a health line for each data source so a gap shows as a gap. Beneath it, one ranked portfolio of opportunities, from solar and batteries to peak shaving and shared plant feeding several premises over one cable, each plotted by return against investment and held to the business's hurdle rate. Water sits in the same portfolio, reported apart: replacing an open channel with pipe cuts losses from about 30% to 3% on 1.6 million kilolitres a year.
The situation
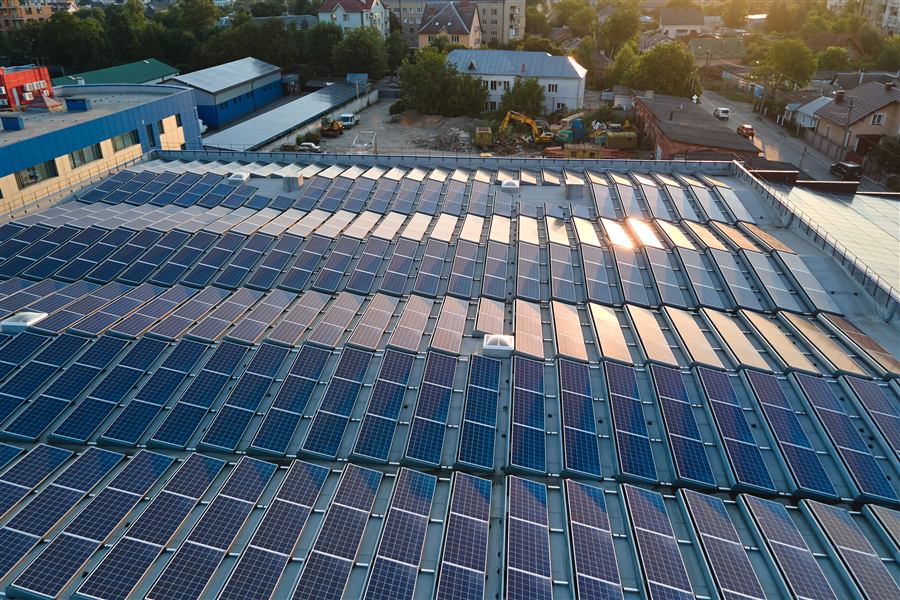
Three large-roof sites in one business, the kind of roof a packhouse, warehouse or factory has, each signed a ten-year solar power purchase agreement on its own utility account, at rates between roughly 90c and R1.20 per kWh escalating at 6% a year. The invoices arrived monthly. Nobody had checked them against the utility bill, the inverters, or what the contracts said the plants would produce.
What we brought together
- The signed contracts: rate, escalation, term, expected and guaranteed output, degradation, deemed-energy terms and buy-out mechanism.
- Monthly PPA invoices and the utility bills for the same months.
- Hourly data from each plant's monitoring platform.
- An independent yield benchmark for each array's real orientation and tilt.
What the checks found
- The largest plant is performing; the contract's expectation was optimistic. That decides whether the conversation with the provider is about maintenance or about the contract.
- One site exports most of what its plant generates. Every kWh is paid for at the contract rate, but an exported kWh earns far less than one that displaces grid supply.
- Every PPA invoice is now matched to the plant's own meter, and utility export credits to PPA generation, each month.
What the client now has
For each site, four options on ten-year cost at its own cost of capital: keep the PPA, buy the plant out under the contract's formula, buy out and extend, or keep the PPA and add panels alongside. Any shortfall credit under the guarantee is estimated from measured output and stated as an upper bound.
The situation
A business planning a second phase of solar on its roofs held quotes from suppliers who had approached it, each priced differently: a lump sum, a rate per kWh under a PPA, a price per watt with items excluded. They were written in different years against different designs. None could be set beside another, and none said what the plant should cost to build.
What we brought together
- Each quote broken into kit quantities priced at distributor cost, with labour and margin as the remainder.
- A cost index that brings every price to today's rand, with hardware and services tracked separately.
- Supplier prices for cabling and balance of plant, in place of rules of thumb.
- The site's load profile and the utility's export charges.
What the checks found
- An untendered deal had come in at about 1.47 times modelled build cost; a competitive tender for comparable work at 1.34.
- The phase-two design would export more than half its generation, and above 500 kW the export connection attracts a daily charge about three times higher. No quote addressed either point.
- Supplier cable prices came in about a third below the rule-of-thumb allowance, so the modelled case improved.
What the client now has
Every option on one basis: capital, annual saving, payback, internal rate of return and ten-year cost, with the quote reference carried beside each figure so it can be traced. And a benchmark build cost to negotiate against.
Does this sound familiar?
- Several sites or accounts, and no one figure for what the business pays for electricity or water.
- Bills that are paid, but never recomputed against the tariff.
- Solar or batteries installed, and nobody checking them against what was promised.
- Supplier quotes you cannot set beside each other, or did not ask for.
- A list of project ideas with no agreed way to rank them.
This applies to any business with a large roof and a meaningful electricity bill: packhouses and cold stores, warehouses and distribution centres, factories and processing plants, and multi-site commercial property.
We are independent of the suppliers whose quotes we compare.
Talk to an engineer About Invint →